LED Wall Washer Spacing Calculation — Uniformity, Mounting Distance and the DIALux Method
TPK Lighting Engineering Team·Based on IES test data: LWW-PZT-W38A & LWW-WZB-W55·10 min read
Getting wall washer spacing wrong is one of the most common — and most visible — mistakes in facade lighting. Too far apart and you get dark bands between fixtures. Too close and you waste budget. This guide explains the geometry, the key variables, and how to verify with real IES data before specifying fixture quantities.
The Three Variables That Determine Everything
Wall washer spacing is controlled by three independent variables. You cannot optimise one without considering the other two.
Mounting distance (D) — the horizontal distance from the fixture to the facade surface. This determines how the beam spreads vertically on the wall. A closer fixture creates a narrower, brighter ellipse. A further fixture spreads light across more facade height but at lower illuminance.
Spacing (S) — the centre-to-centre distance between adjacent fixtures along the facade. This determines horizontal uniformity. Wide spacing creates visible dark zones between fixtures.
Beam angle (θ) — wider beams spread light across more wall area but at lower peak intensity. Narrower beams concentrate light for longer throws or higher illuminance on specific zones.
The goal is to find a combination of D and S that delivers acceptable uniformity across the facade — typically a uniformity ratio (Emin/Emax) of 0.3 or above — within the project's illuminance target and fixture budget.
Definition
Uniformity ratio (Emin/Emax) is the ratio of the minimum measured illuminance on the surface to the maximum. A ratio of 1.0 is perfectly uniform. A ratio of 0.3 means the darkest point receives 30% of the illuminance of the brightest point — the lower boundary of acceptable quality for most architectural applications.
The IES Data Behind This Guide
All calculations in this guide are based on real IES photometric test data from TPK's in-house laboratory, tested on the EVERFINE GO-2000B system. Two models are used as worked examples, representing the two most common facade lighting scenarios.
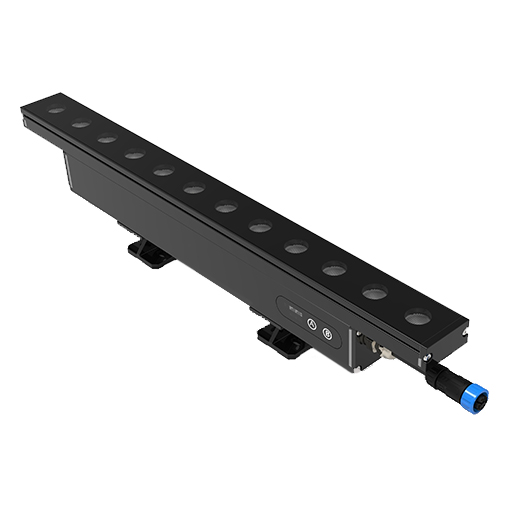
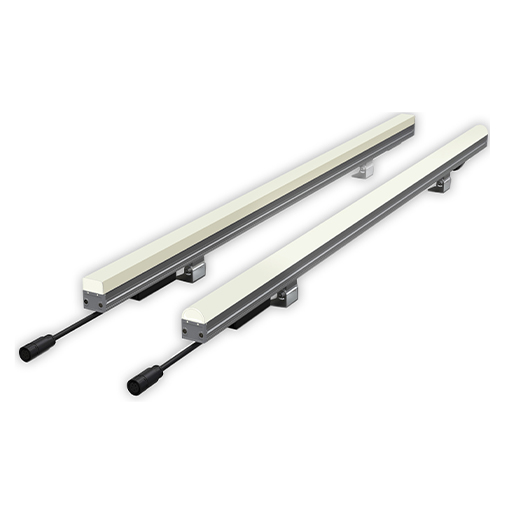
LWW-PZT-W38A-L10-S
15° Narrow Beam — Grazing & Close-Mount
Measured Power35.76 W
Total Flux5,563 lm
Efficacy155.6 lm/W
Beam Angle (50% Imax)H 15.3° × V 17.4°
Peak Intensity (Imax)33,535 cd
@ 10m: Eavg / Emax221.7 / 336.9 lx
@ 10m: Beam diameter268 cm
NEMA TypeType 3
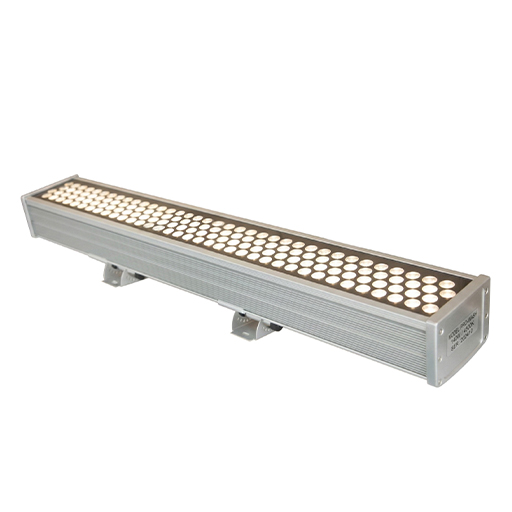
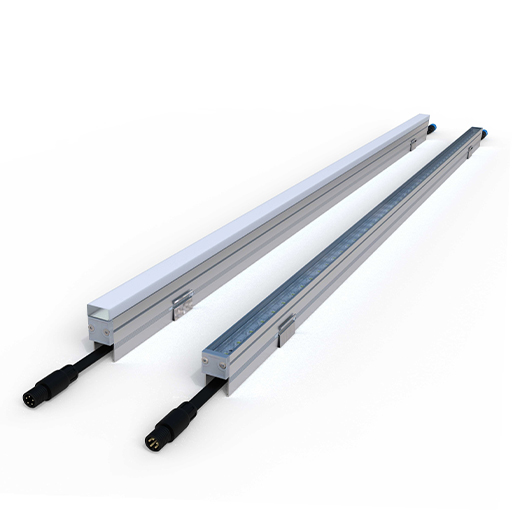
LWW-WZB-W55-L12-S
25° Medium Beam — Standard Facade Wash
Measured Power63.54 W
Total Flux8,792 lm
Efficacy138.4 lm/W
Beam Angle (50% Imax)H 28.5° × V 28.1°
Peak Intensity (Imax)23,630 cd
@ 10m: Eavg / Emax136.4 / 225.4 lx
@ 10m: Beam diameter501 cm
NEMA TypeType 4
Step 1 — Calculate Beam Spread at Your Mounting Distance
The horizontal beam spread on the wall surface at a given mounting distance D can be estimated from the beam angle geometry. Using half the beam angle:
Beam Spread Formula
Spread = 2 × D × tan(θ/2)
D = mounting distance (m) · θ = beam angle at 50% Imax · Spread = illuminated width on wall (m)
LWW-PZT-W38A (15° beam) — spread at various mounting distances
Mounting Distance D
θ/2
Beam Spread on Wall
Typical Spacing Range
0.5 m
7.5°
≈ 0.13 m
0.3 – 0.5 m
0.8 m
7.5°
≈ 0.21 m
0.5 – 0.8 m
1.0 m
7.5°
≈ 0.26 m
0.6 – 1.0 m
1.5 m
7.5°
≈ 0.40 m
1.0 – 1.5 m
2.0 m
7.5°
≈ 0.53 m
1.2 – 2.0 m
LWW-WZB-W55 (25° beam) — spread at various mounting distances
Mounting Distance D
θ/2
Beam Spread on Wall
Typical Spacing Range
0.5 m
12.5°
≈ 0.22 m
0.5 – 0.8 m
0.8 m
12.5°
≈ 0.36 m
0.8 – 1.2 m
1.0 m
12.5°
≈ 0.45 m
1.0 – 1.5 m
1.5 m
12.5°
≈ 0.67 m
1.5 – 2.2 m
2.0 m
12.5°
≈ 0.89 m
2.0 – 3.0 m
Engineering Note
The "Typical Spacing Range" above assumes Emin/Emax ≥ 0.3. For higher uniformity requirements (heritage facades, hotel lobbies, broadcast-grade sports lighting), reduce spacing by 20–30%. For infrastructure and bridge lighting where uniformity requirements are less strict, spacing can be increased to the upper end of the range.
Step 2 — The Inverse Square Law and Illuminance at Distance
Illuminance falls with the square of the distance from the source. The IES test reports provide measured average and maximum illuminance (Eavg, Emax) at a reference height of 10m — the standard AAI (Average Aiming Illuminance) calculation. You can scale these values to other throw distances using:
Inverse Square Law — Scaling Illuminance
E₂ = E₁ × (D₁ / D₂)²
E₁ = illuminance at reference distance D₁ · E₂ = illuminance at new distance D₂
LWW-PZT-W38A (15°) — illuminance at various throw distances
IES baseline: Eavg = 221.7 lx at 10m
Throw Distance
Eavg (calculated)
Emax (IES actual)
Application
1 m
22,170 lx
33,692 lx
Grazing on textured stone
3 m
2,463 lx
—
Low-rise facade close-mount
5 m
887 lx
1,348 lx (IES)
Mid-range facade
8 m
346 lx
526 lx (IES)
Standard wall wash 8m throw
10 m
222 lx
337 lx (IES)
IES reference height
15 m
99 lx
—
High-rise from ground
LWW-WZB-W55 (25°) — illuminance at various throw distances
IES baseline: Eavg = 136.4 lx at 10m
Throw Distance
Eavg (calculated)
Emax (IES actual)
Application
1 m
13,640 lx
22,543 lx (IES)
Grazing application
4 m
853 lx
1,409 lx (IES)
Low-rise facade
6 m
379 lx
626 lx (IES)
Mid-rise
8 m
213 lx
352 lx (IES)
Standard facade 8m mounting
10 m
136 lx
225 lx (IES)
IES reference height
12 m
95 lx
—
High-rise supplementary
Step 3 — Worked Examples: Two Facade Scenarios
Scenario A — Stone facade, close-mount grazing
LWW-PZT-W38A · 15° beam · 0.8m mounting distance
Building height: 12m, stone cladding
Fixture mounted at 0.3m AFF, 0.8m from wall
Target: emphasise stone texture, min 150 lx average
Beam spread at 0.8m: ≈ 0.21m
Eavg at 0.8m throw: 221.7 × (10/0.8)² ≈ 34,600 lx
Recommended spacing: 0.6 – 0.8m c/c
Result: strong grazing effect, high uniformity at close spacing
Scenario B — Glass facade, standard wash
LWW-WZB-W55 · 25° beam · 1.5m mounting distance
Building height: 20m, glass curtain wall
Fixture mounted at grade, 1.5m from wall
Target: uniform wash, min Emin/Emax 0.35
Beam spread at 1.5m: ≈ 0.67m
Eavg at 1.5m throw: 136.4 × (10/1.5)² ≈ 6,062 lx
Recommended spacing: 1.5 – 2.0m c/c
Verify upper facade illuminance with DIALux simulation
⚠ Important Limitation
The calculations above use the beam spread formula as a first estimate only. Facade geometry, surface reflectance, aiming angle and the actual photometric distribution (which is not symmetrical — see the asymmetric IES isolux diagrams) all affect the real result. Always verify with a full DIALux or AGi32 simulation using the actual IES file before finalising fixture quantities and spacing.
Step 4 — Uniformity Ratio: Reading the IES Data
The IES reports include Eavg and Emax at each throw distance. The ratio Eavg/Emax gives an indication of the distribution's internal uniformity at a single fixture level. For the two models:
Model
@ 10m: Eavg
@ 10m: Emax
Eavg/Emax
Interpretation
LWW-PZT-W38A (15°)
221.7 lx
336.9 lx
0.66
Good internal uniformity
LWW-WZB-W55 (25°)
136.4 lx
225.4 lx
0.61
Good internal uniformity
These ratios describe the distribution within a single fixture's cone. The inter-fixture uniformity — the dark zones between adjacent fixtures — is what spacing calculation addresses. The two values are related but distinct: a fixture can have excellent internal uniformity and still produce dark bands on the facade if the spacing is too wide.
Uniformity reference targets by application
Application
Emin/Emax Target
Guidance
Bridge & infrastructure
≥ 0.25
Moderate — practical, allows wider spacing
Standard commercial facade
≥ 0.30
Standard — industry baseline for architectural
Hotel & hospitality
≥ 0.35
High — tighter spacing required
Heritage & cultural buildings
≥ 0.40
High — close spacing, careful aiming
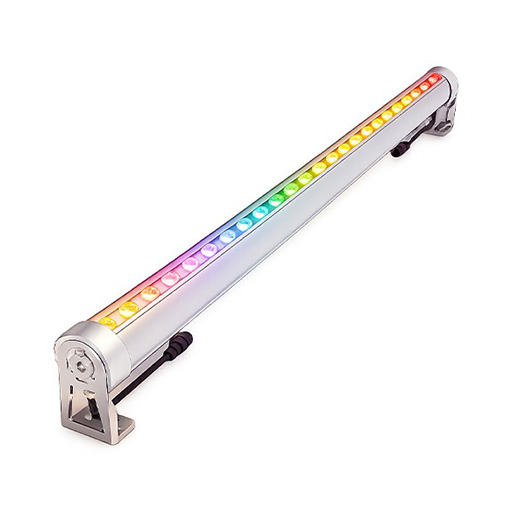
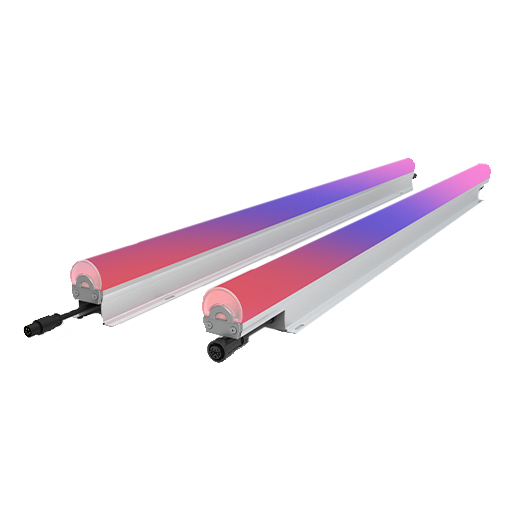
RGBW dynamic facades
≥ 0.40
High — colour non-uniformity is more visible
Broadcast stadium
≥ 0.50
Critical — camera-grade uniformity required
Step 5 — Verify with DIALux
Hand calculations confirm the order of magnitude and give you a starting spacing to test. DIALux (free) or AGi32 gives you the actual result with real IES data, real facade geometry and real aiming angles. The workflow is straightforward:
01
Import the IES file
In DIALux evo: Insert → Luminaire → From File → .ies. Download TPK IES files at no charge from tpk-led.com/Resources. Verify the luminous intensity distribution curve matches the model you are specifying.
02
Build the facade calculation surface
Create a vertical calculation plane on the facade surface at the building's actual coordinates. Set surface reflectance to match the facade material — typically 0.3–0.4 for stone, 0.1–0.15 for dark glass, 0.5–0.6 for white render. This significantly affects the illuminance result.
03
Place fixtures at the calculated starting spacing
Use your hand-calculated spacing as the starting point. Set mounting distance to match the site condition. Aim fixtures at 60–70% of facade height — not straight ahead — to balance vertical distribution. For a 15m facade, aim at approximately 9–10m height.
04
Run the calculation and read uniformity
In the results: Emin / Emax = uniformity ratio. If below target, reduce spacing by 10–15% and recalculate. Check for scalloping — visible arcs of brighter light from individual fixtures — by inspecting the false-colour plan view.
05
Adjust aiming angle and re-run
Aiming angle has a large effect on vertical distribution and uniformity. The IES distribution for both models is slightly asymmetric (confirmed in the isocandela diagrams). Rotating the fixture 5–10° toward the wall from the default aiming can significantly improve upper-facade illuminance without changing fixture count.
TPK Engineering Support
TPK's engineering team can run the DIALux simulation for your project. Send your facade dimensions, material type, mounting position and illuminance target to ES2@topkinglite.com. We return a photometric simulation report with recommended fixture model, spacing and aiming angle — at no charge.
Quick Reference — Spacing Rules of Thumb
These ratios give a practical starting point for initial calculations. Always verify with IES-based simulation.
Beam Angle
S/D Ratio (spacing/mounting distance)
Expected Uniformity
Suitable For
15° (LWW-PZT-W38A)
0.6 – 0.8
Emin/Emax ≈ 0.35–0.45
Textured stone, grazing, heritage
25° (LWW-WZB-W55)
1.0 – 1.5
Emin/Emax ≈ 0.30–0.40
Standard facade wash, glass, smooth surfaces
30°
1.2 – 1.8
Emin/Emax ≈ 0.25–0.35
Wide facade, lower uniformity requirement
45°
1.5 – 2.5
Emin/Emax ≈ 0.20–0.30
Very wide spread, bridge decks
FAQ
As spacing increases, the distance between adjacent fixture beams grows. The overlap zone — where the tails of two adjacent beams add together — shrinks and eventually disappears, leaving a dark band. The Emin point is always in the gap between fixtures, not at the centre of any beam. Reducing spacing moves the beams closer together, increasing the minimum illuminance in the gap and therefore improving Emin/Emax.
The IES isocandela diagram shows the LWW-PZT-W38A beam is slightly offset — the half-peak spread is U:6.7°, D:10.9° vertically, meaning the beam extends further downward than upward from the aiming axis. When the fixture is aimed slightly upward toward the facade, this asymmetry distributes light more evenly from low to high on the wall. This is why aiming at 60–70% of facade height rather than at the top produces better vertical uniformity. The IES file captures this asymmetry; hand calculations using a single beam angle value do not.
IES calculations give incident illuminance — the light hitting the surface — not reflected luminance. The visual brightness you see depends on both illuminance and reflectance. A polished dark granite at 150 lx will look darker than a white render at 50 lx. For simulation purposes, set the facade reflectance accurately: white render 0.6–0.7, limestone 0.4–0.5, sandstone 0.3–0.4, dark granite 0.1–0.2, tinted glass 0.08–0.15.
No — RGBW requires tighter spacing than single-colour. When an RGBW fixture produces saturated colour (for example, 100% red with green and blue off), the luminous flux is approximately 20–30% of the white output. The beam spread is similar but the illuminance at the wall is significantly lower. More critically, colour non-uniformity — where the wall shows one hue near fixtures and a different hue in between — is more visually disturbing than illuminance non-uniformity. Reduce RGBW spacing by 20–30% compared to the equivalent white calculation.
Yes. Send your facade dimensions (height, width), surface material and reflectance estimate, mounting position (mounting distance from wall, height above grade), and illuminance target to ES2@topkinglite.com. TPK's engineering team will run the simulation and return a photometric report with recommended model, spacing, fixture count and aiming angle. This service is provided at no charge as part of the project supply process.